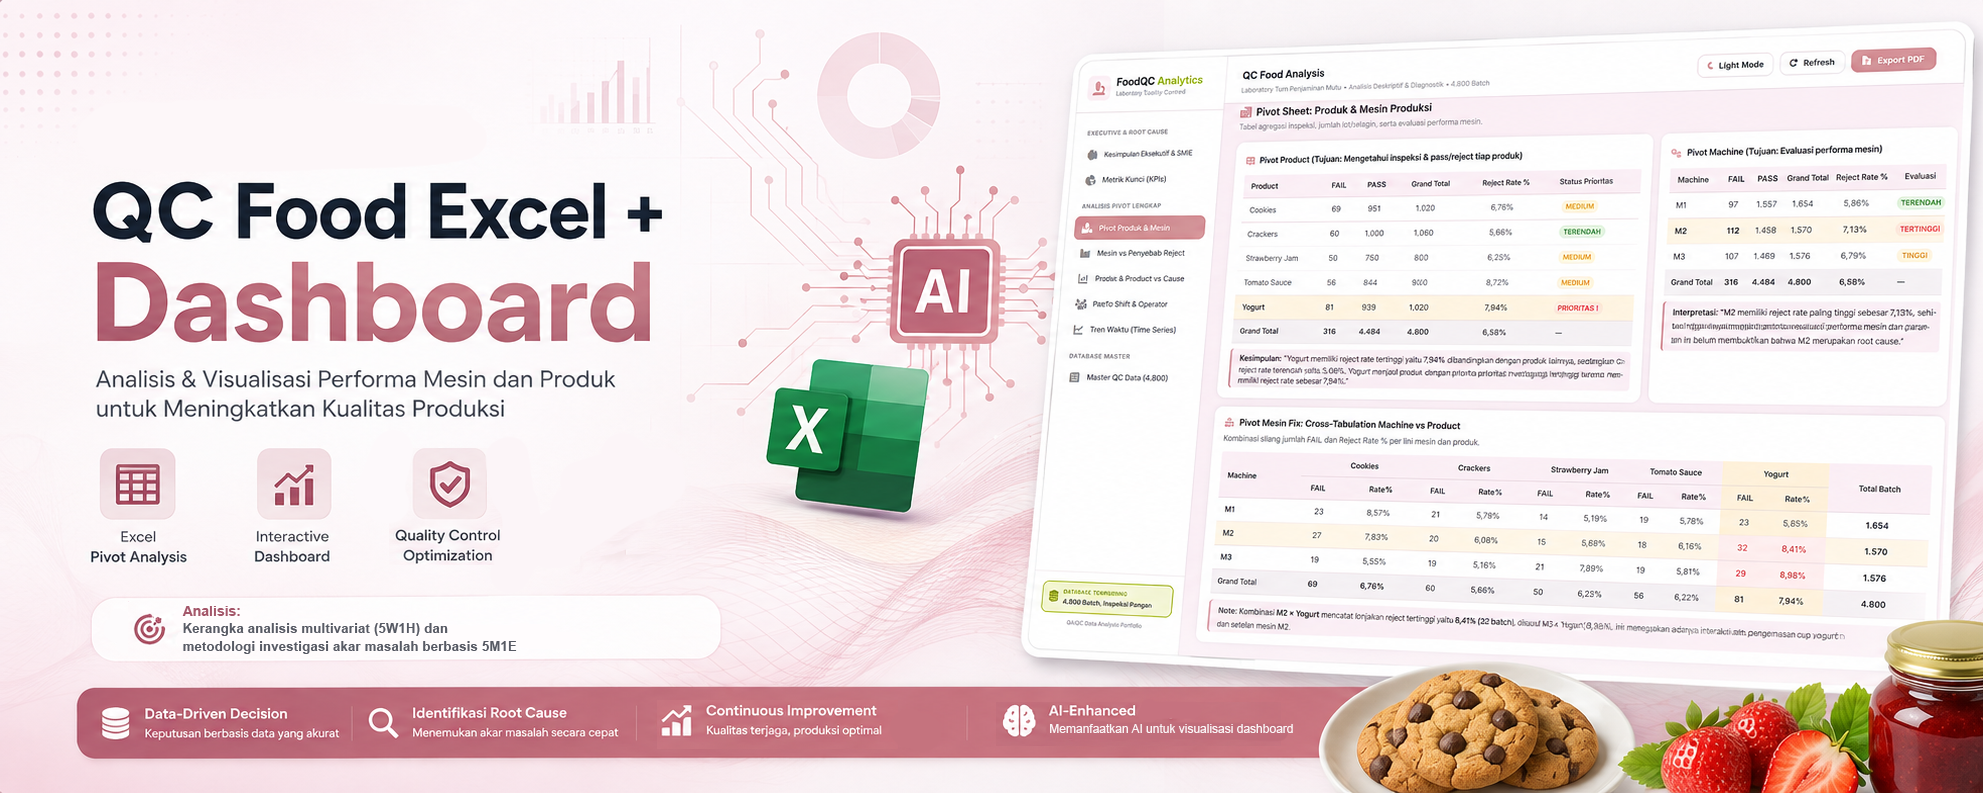
QC Analysis Dashboard
Analyzing 4,800 production batches to identify reject patterns and process improvement priorities.
Results & Impact
• Analyzed reject patterns across product, machine, shift, and operator factors using PivotTables.
• Evaluated product–machine, product–reject cause, and machine–reject cause relationships to identify key contributing factors.
• Applied Pareto analysis to prioritize major reject causes and improvement parameters.
• Analyzed daily, weekly, and monthly reject trends to identify recurring fluctuations over time.
• Utilized AI-assisted support in dashboard development and visualization, with the analytical findings independently reviewed and refined.
Output Documents
| Document Name | Description | File |
|---|---|---|
| QC Dashboard | Interactive dashboard visualizing QC performance, reject patterns, key contributing factors, and time-based trends. | Dashboard |
| QC Data Analysis Workbook | Supporting Excel workbook containing calculations and quality data analyses used to develop the QC dashboard. | Download XLSX |